Climate and Weather Charts
Tobago Arthur Napoleon Raymond Robinson International Airport (TAB)
(Tobago, West Indies - , Tobago)

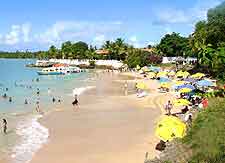
The island of Tobago features a marine, tropical climate and lies close to the coast of Venezuela. Part of the Republic of Trinidad and Tobago, comprising 23 different islands in total, Tobago experiences hot and sunny weather all through the year.
January, February, March and April tend to be the driest months on Tobago and are often referred to as the island's 'dry season'. The climate begins to get noticeably wetter as June and July arrive, when showers can be heavy and unexpected, often clearing as quickly and they arrived. The average annual daytime temperatures on Tobago are around 32°C / 89°F.
Climate Description: Marine, tropical climate
Tobago Crown Point Airport (TAB) Location: Northern Hemisphere, Tobago, West Indies
Annual High / Low Daytime Temperatures at Tobago: 32°C / 31°C (90°F / 88°F)
Average Daily January Temperature: 31°C / 88°F
Average Daily June Temperature: 32°C / 90°F
Annual Rainfall / Precipication Tobago at Airport (TAB): 1750 mm / 69 inches
Tobago Crown Point Airport (TAB):
Climate and Weather Charts
Temperature Chart |
| Temperatures |
Jan |
Feb |
Mar |
Apr |
May |
Jun |
Jul |
Aug |
Sep |
Oct |
Nov |
Dec |
Average |
Maximum
Celcius (°C) |
31 |
31 |
32 |
32 |
32 |
32 |
32 |
32 |
32 |
32 |
31 |
31 |
32 |
Minimum
Celcius (°C) |
21 |
21 |
21 |
22 |
23 |
23 |
23 |
23 |
23 |
22 |
22 |
22 |
22 |
Maximum
Fahrenheit (°F) |
88 |
88 |
90 |
90 |
90 |
90 |
90 |
90 |
90 |
90 |
88 |
88 |
89 |
Minimum
Fahrenheit (°F) |
70 |
70 |
70 |
72 |
73 |
73 |
73 |
73 |
73 |
72 |
72 |
72 |
72 |
Rainfall / Precipitation Chart |
| Rainfall |
Jan |
Feb |
Mar |
Apr |
May |
Jun |
Jul |
Aug |
Sep |
Oct |
Nov |
Dec |
Total |
| Rainfall (mm) |
71 |
43 |
30 |
46 |
112 |
254 |
249 |
239 |
183 |
178 |
198 |
147 |
1750 |
| Rainfall (inches) |
2.8 |
1.7 |
1.2 |
1.8 |
4.4 |
10.0 |
9.8 |
9.4 |
7.2 |
7.0 |
7.8 |
5.8 |
69 |
| Tobago Days of Rain |
10 |
6 |
5 |
6 |
9 |
16 |
17 |
15 |
14 |
16 |
16 |
12 |
142 |
Seasonal Chart |
| Seasons |
Average
Temp
(Max °C) |
Average
Temp
(Min °C) |
Average
Temp
(Max °F) |
Average
Temp
(Min °F) |
Total
Rainfall
(mm) |
Total
Rainfall
(inches) |
| Mar to May (Spring) |
32 |
22 |
90 |
72 |
188 |
7 |
| Jun to Aug (Summer) |
32 |
23 |
90 |
73 |
742 |
29 |
| Sept to Nov (Autumn / Fall) |
32 |
22 |
89 |
72 |
559 |
22 |
| Dec to Feb (Winter) |
31 |
21 |
88 |
71 |
261 |
10 |
 The island of Tobago features a marine, tropical climate and lies close to the coast of Venezuela. Part of the Republic of Trinidad and Tobago, comprising 23 different islands in total, Tobago experiences hot and sunny weather all through the year.